
Our strategy and performance
OUR STRATEGY
Through collaboration and innovation, we will grow profitably, using our strength as a sustainable and diversified global woodfibre group, focused on dissolving pulp, packaging and speciality papers, and biomaterials with an optimised graphic paper business.

Grow our business
What this means
- Grow dissolving pulp (DP) capacity, matching market demand
- Continue to expand and grow packaging and speciality papers in all regions. Commence commercialisation of biotech opportunities
- Optimise Graphic paper segment.
How we performed in 2022
- Packaging and speciality papers constitutes 25% of 2022 sales volumes
- Packaging and speciality papers EBITDA increased 37% y-o-y and contributed 27% of group EBITDA
- Increased packaging and speciality papers volumes y-o-y up 9% vs 2021
- Pulp sales increased 15% compared to the prior year
- Successful commissioning of DP expansion project at Saiccor
- Concluded the agreement to sell three European graphic paper mills to consolidate our graphic paper assets and focus on core graphic paper categories
- Strong growth in lignin sales and favourable advancement of other biotech opportunities.

Sustain our financial health
What this means
- Target net debt at approximately US$1 billion and sustain net debt:EBITDA* at 1.5x through the cycle
- Optimise capital management
- Maximise return on capital employed (ROCE)
- Review pricing strategies to secure optimal value
- Continue to monitor bond market for opportunities.
How we performed in 2022
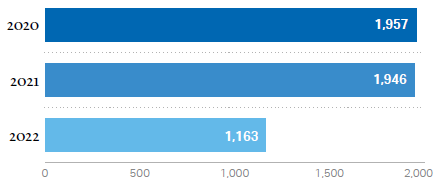
- Reduced net debt to US$1,163 million
- Generated > US$500 million cash
- Focused capital expenditure (capex) on essential projects to effectively manage liquidity and cash flow
- Average net sales price per ton up 28% y-o-y.

Drive operational excellence
What this means
- Drive our safety-first culture
- Continuously improve our cost position
- Continue to maximise the benefits of our global footprint
- Best-in-class production efficiencies to secure increased volumes.
How we performed in 2022
- Record safety performance
- Group efficiency, procurement and continuous improvement savings > US$110 million
- Volumes and pricing improved resulting in improved profitability
- Maximised the benefits of OneSappi to achieve cost advantages.

Enhance trust
What this means
- Improving our understanding of, and proactively partnering with, all stakeholders
- Driving sustainability solutions
- Meeting the changing needs of every Sappi employee.
How we performed in 2022
- Validated our decarbonisation targets with the Science Based Targets initiative (SBTi)
- Actively supported local communities through community forums
- Followed Task Force on Climate-related Financial Disclosures (TCFD) recommendations
- Expanded Supplier Code of Conduct compliance and initiated EcoVadis partnership
- Sustained Level 1 broad-based black economic empowerment (BBBEE) in South Africa.
* Earnings before interest, taxation, depreciation and amortisation (EBITDA).
MEASURING OUR PROGRESS
Guided by our strategy, we measure our progress holistically against our mission, collaborating and partnering with stakeholders as we strive to be a trusted and sustainable organisation with an exciting future in woodfibre.
- ROCE (%)
- EBITDA (US$ million)
- EBITDA margin (%)
- Sales (US$ million)
- Net debt (US$ million)
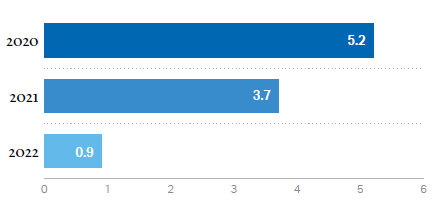
- Net debt:EBITDA (ratio)
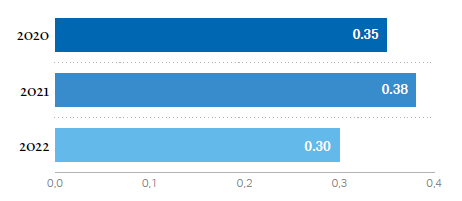
- Lost-time injury frequency rate (LTIFR) (per million work hours)1
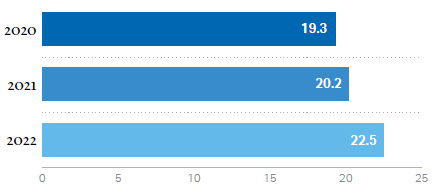
- Gender diversity (%)
- Supplier Code of Conduct (%)
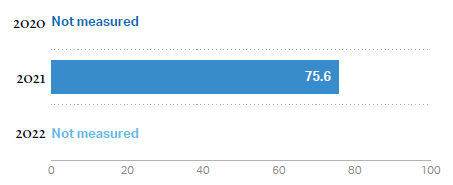
- Sustainable engagement (%)
- Specific process water usage in water stressed locations (m3/adt)
- Share of renewable and clean energy (%)
- Energy intensity (GJ/adt)
- Specific GHG (Scope 1 + 2) emissions (kg CO2e/adt)
- Solid waste to landfill (kg/adt)
- Certified fibre (%)
Indicator selector - Click each bullet below for more information
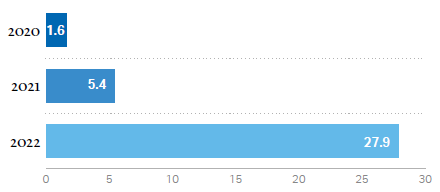
ROCE (%)
ROCE (%)
Our strategic performance indicators
Self-assessment of 2022 performance

Link to Thrive25 strategic objectives

Link to 3Ps & SDGs

Why is this important?
ROCE is an important measure that assesses long-term profitability by comparing how effectively assets are performing with how these assets are financed.
△ Identified sustainability goal
® Linked to executive remuneration
2023 objectives
- Maximise volumes in all segments and improve logistics constraints
- Further optimise the packaging and speciality papers volumes in all regions.

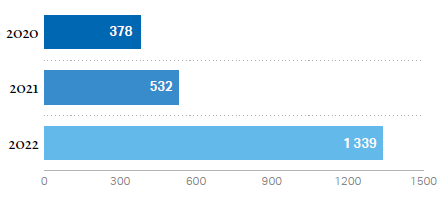
EBITDA (US$ million)
EBITDA (US$ million)
Our strategic performance indicators
Self-assessment of 2022 performance
Link to Thrive25 strategic objectives

Link to 3Ps & SDGs
Why is this important?
EBITDA measures how we performed operationally as a company.
® Linked to executive remuneration
2023 objectives
- Focus on maximising cash generation through efficient capex and working capital management.
EBITDA margin (%)
EBITDA margin (%)
Our strategic performance indicators

Self-assessment of 2022 performance
Link to Thrive25 strategic objectives
Link to 3Ps & SDGs
Why is this important?
EBITDA margin is an important and comparable measure of our profitability (excluding the impact of financing, accounting treatments or tax implications) against our revenue.
2023 objectives
- Sustain margins in all business segments
- Focus on reducing fixed and variable costs
- Maintain high operating rates.
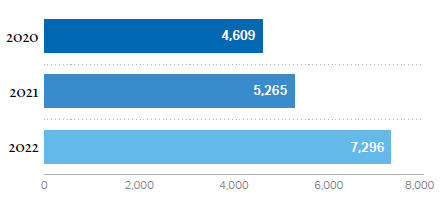
Sales (US$ million)
Sales (US$ million)
Our strategic performance indicators
Self-assessment of 2022 performance
Link to Thrive25 strategic objectives
Link to 3Ps & SDGs
Why is this important?
While not the only determinant of financial success, sales is a key measure of demand, customer loyalty and a critical contributor to profit.
2023 objectives
- Continue to grow and optimise packaging and speciality papers and to fully operate our paper machine assets
- Maximise DP volumes to capacity with increased volumes from Saiccor Mill.
Net debt (US$ million)
Net debt (US$ million)
Our strategic performance indicators
Self-assessment of 2022 performance

Link to Thrive25 strategic objectives
Link to 3Ps & SDGs
Why is this important?
Given the capital-intensive nature of our operations, we need to raise debt to complete significant projects that enable our long-term success. Net debt comprises current and non-current interest-bearing borrowings and bank overdrafts (net of cash, cash equivalents and short-term deposits).
2023 objectives
- During 2023 our target is to reduce net debt to below US$1 billion.
Net debt:EBITDA (ratio)
Net debt:EBITDA (ratio)
Our strategic performance indicators
Self-assessment of 2022 performance
Link to Thrive25 strategic objectives
Link to 3Ps & SDGs
Why is this important?
The net debt to EBITDA ratio measures our ability to pay off our debt should net debt and EBITDA remain consistent. EBITDA focuses on the operating decisions of a business as it looks at profitability from core operations before the impact of capital structure.
® Linked to executive remuneration
2023 objectives
- With significantly reduced net debt, we aim to sustain this ratio to less than 1.5x through the cycle.
Lost-time injury frequency rate (LTIFR) (per million work hours)1
Lost-time injury frequency rate (LTIFR) (per million work hours)1
Our strategic performance indicators
Self-assessment of 2022 performance

Link to Thrive25 strategic objectives

Link to 3Ps & SDGs

Why is this important?
LTIFR is an important measure of our business’s safety. We target zero harm in the workplace Injury Index and aim for at least 10% improvement year-on-year.
® Linked to executive remuneration
△ Identified sustainability goal2
2023 objectives
- Continue to reduce LTIFR and achieve zero fatalities.
| 1 | Combined employee and contractor LTIFR. |
| 2 | For this indicator, we have clear targets for 2025 that we are working towards. See our Group Sustainability Report for more information. |
Gender diversity (%)
Gender diversity (%)
Our strategic performance indicators
Self-assessment of 2022 performance
Link to Thrive25 strategic objectives
Link to 3Ps & SDGs
Why is this important?
We view diversity as a key driver that enhances our competitiveness and viability as a business and contributes to a thriving world. We aim to appoint more women in management roles.
△ Identified sustainability goal
2023 objectives
- Stay on track to reach 23% of women in senior positions – HRL19 and upwards by 2025.
Supplier Code of Conduct (%)
Supplier Code of Conduct (%)
Our strategic performance indicators

Self-assessment of 2022 performance
Link to Thrive25 strategic objectives
Link to 3Ps & SDGs
Why is this important?
Research indicates that 85% of consumers are more likely to buy from a company with a reputation for sustainability. By working in partnership with suppliers, we can better identify risk, assess social and environmental performance, and encourage commitment to sustainable choices and the SDGs throughout our value chain.
△ Identified sustainability goal
2023 objectives
- Stay on track to reach 80% procurement spend with declared compliance with Supplier Code of Conduct.
Sustainable engagement (%)
Sustainable engagement (%)
Our strategic performance indicators
Self-assessment of 2022 performance
Link to Thrive25 strategic objectives

Link to 3Ps & SDGs
Why is this important?
We rely on a productive and engaged workforce. Employee engagement has been linked to higher safety performance, lower staff turnover, improved productivity and efficiency.
△ Identified sustainability goal
2023 objectives
- Sustain and/or improve percentage of staff engaged with our business from our base of 75%.
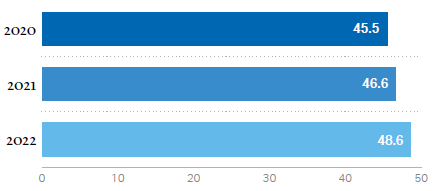
Specific process water usage in water stressed locations (m3/adt)
Specific process water usage in water stressed locations (m3/adt)
Our strategic performance indicators
Self-assessment of 2022 performance
Link to Thrive25 strategic objectives
Link to 3Ps & SDGs

Why is this important?
Water has been identified as one of the most serious sustainability challenges facing the planet, partly due to the impacts of climate change. Forests and plantations, pulp and paper operations are highly dependent on the use and responsible management of water resources.
△ Identified sustainability goal (for South Africa)
2023 objectives
- Stay on track to reduce specific process water in water-stressed locations by 23% by 2025 against base year 2019 (44.5 m3/adt).
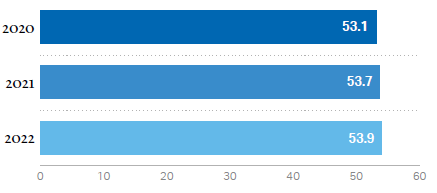
Share of renewable and clean energy (%)
Share of renewable and clean energy (%)
Our strategic performance indicators
Self-assessment of 2022 performance
Link to Thrive25 strategic objectives
Link to 3Ps & SDGs

Why is this important?
This target supports our commitment to carbon emissions reduction and focused action to future-proof our business against the physical and transitional impacts of climate change and be part of the solution.
△ Identified sustainability goal
2023 objectives
- Stay on track to increase share of renewable and clean energy by 8% pts by 2025 against base year 2019 (51.6%).
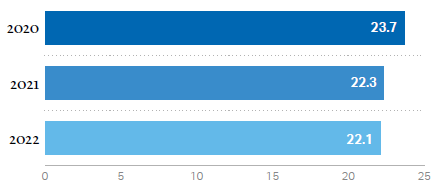
Energy intensity (GJ/adt)
Energy intensity (GJ/adt)
Our strategic performance indicators
Self-assessment of 2022 performance
Link to Thrive25 strategic objectives
Link to 3Ps & SDGs
Why is this important?
Energy intensity is a measure of how efficiently we are operating. By continually improving this metric, we manage costs and lower our environmental impact.
△ Identified sustainability goal1
2023 objectives
- Stay on track to reduce energy intensity by 5% by 2025 against base year 2019 (22.1 GJ/adt).
1 For this indicator, we have clear targets for 2025 that we are working towards. See our Group Sustainability Report for more information.
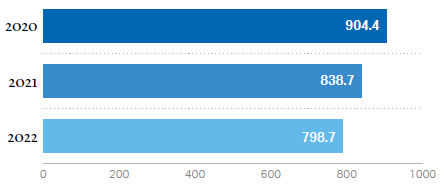
Specific GHG (Scope 1 + 2) emissions (kg CO2e/adt)
Specific GHG (Scope 1 + 2) emissions (kg CO2e/adt)
Our strategic performance indicators
Self-assessment of 2022 performance
Link to Thrive25 strategic objectives
Link to 3Ps & SDGs

Why is this important?
Since the UN Climate Change Conference (COP26) in Glasgow, Scotland in November 2021, climate impacts have worsened and carbon emissions have risen to record levels.
We align with the climate science by having our targets validated by the SBTi and are taking focused action to future-proof our business against the physical and transitional impacts of climate change and be part of the solution.
△ Identified sustainability goal
2023 objectives
- Stay on track to decrease specific GHG emissions (Scope 1 + 2) by 18% by 2025 against base year 2019 (883.4 kg CO2e/adt).
Solid waste to landfill (kg/adt)
Solid waste to landfill (kg/adt)
Our strategic performance indicators

Self-assessment of 2022 performance
Link to Thrive25 strategic objectives

Link to 3Ps & SDGs

Why is this important?
Our continued focus to reduce solid waste to landfill supports the move towards a circular economy. This approach aligns with our purpose of contributing to a thriving world, one with less waste, lower costs and reduced environmental impact.
△ Identified sustainability goal
2023 objectives
- Stay on track to reduce solid waste to landfill by 14% by 2025 against base year 2019 (52.1 kg/adt).
Certified fibre (%)
Certified fibre (%)
Our strategic performance indicators
Self-assessment of 2022 performance
Link to Thrive25 strategic objectives
Link to 3Ps & SDGs

Why is this important?
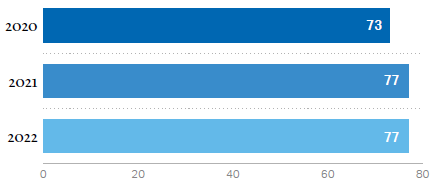
We are committed to sourcing woodfibre from forests and timber plantations in a manner that promotes their health and supports community wellbeing.
△ Identified sustainability goal1
2023 objectives
- Maintain or improve share of certified fibre above 75%.
1 For this indicator, we have clear targets for 2025 that we are working towards. See our Group Sustainability Report for more information.